
Enable Debug Model
LWC 的 JS code 默认是为了加载速度的提升,默认是 minified 的文件,不利于阅读和调试。所有在开发的时候,可以打开 Debug Mode。
To enable debug mode for users in your org:
- In Salesforce, from Setup, enter Debug Mode in the Quick Find box, then select Debug Mode Users.
- Enable the selection checkbox next to users for whom you want to enable debug mode.
- Click Enable.
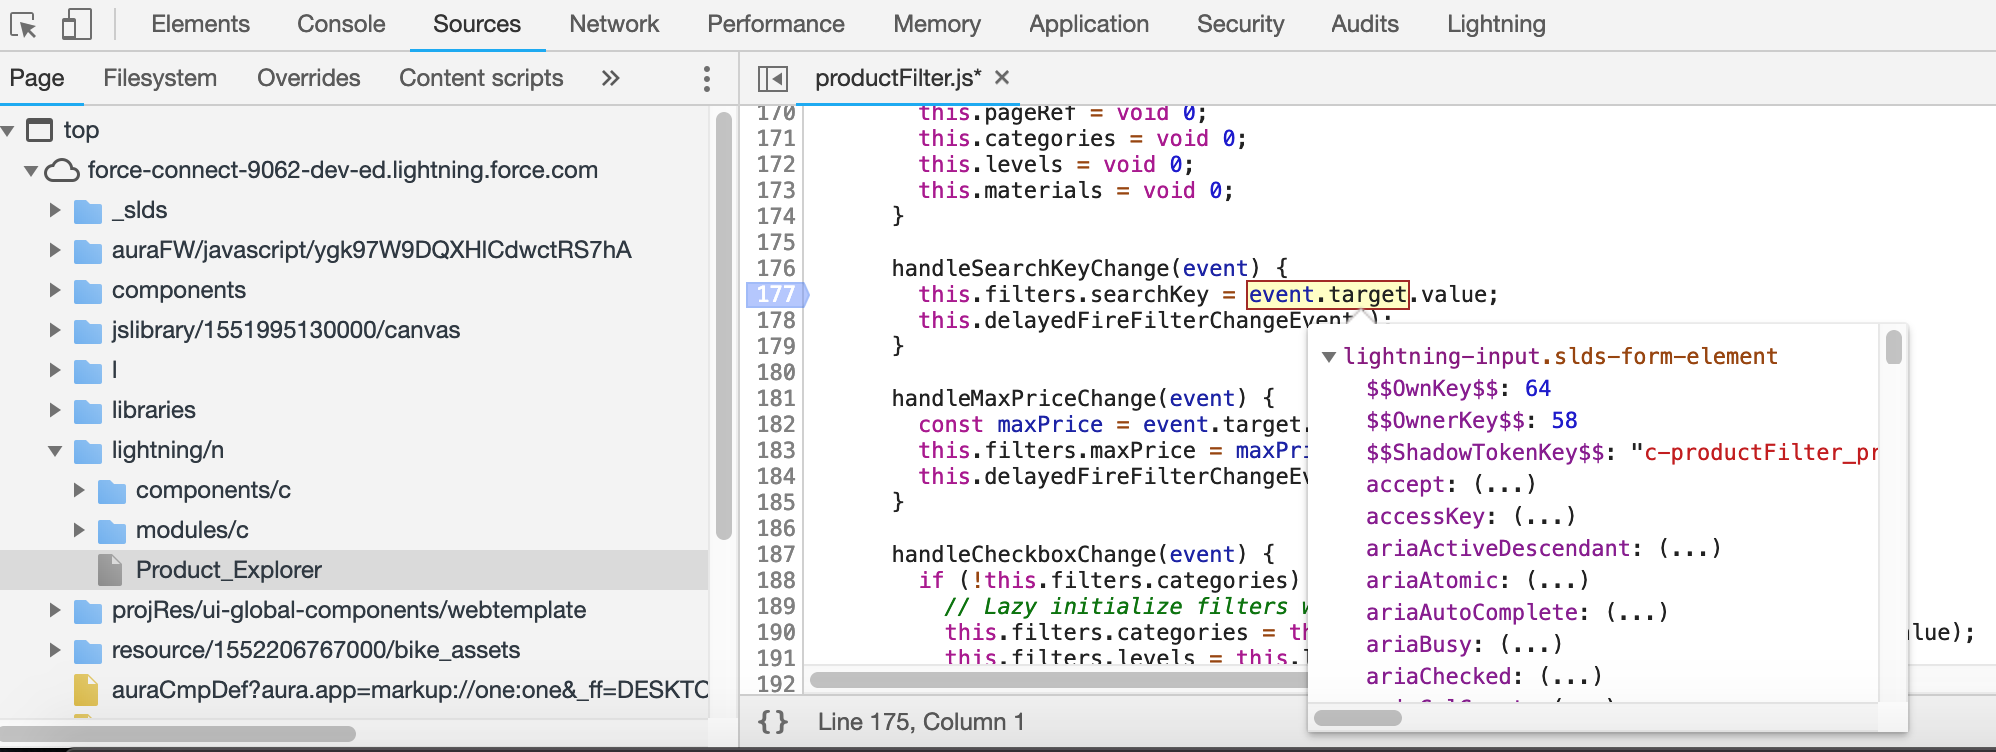
Debug Using Chrome DevTools
开启 Debug Mode 之后,就可以使用 Chrome 的 DevTools 进行断点调试。
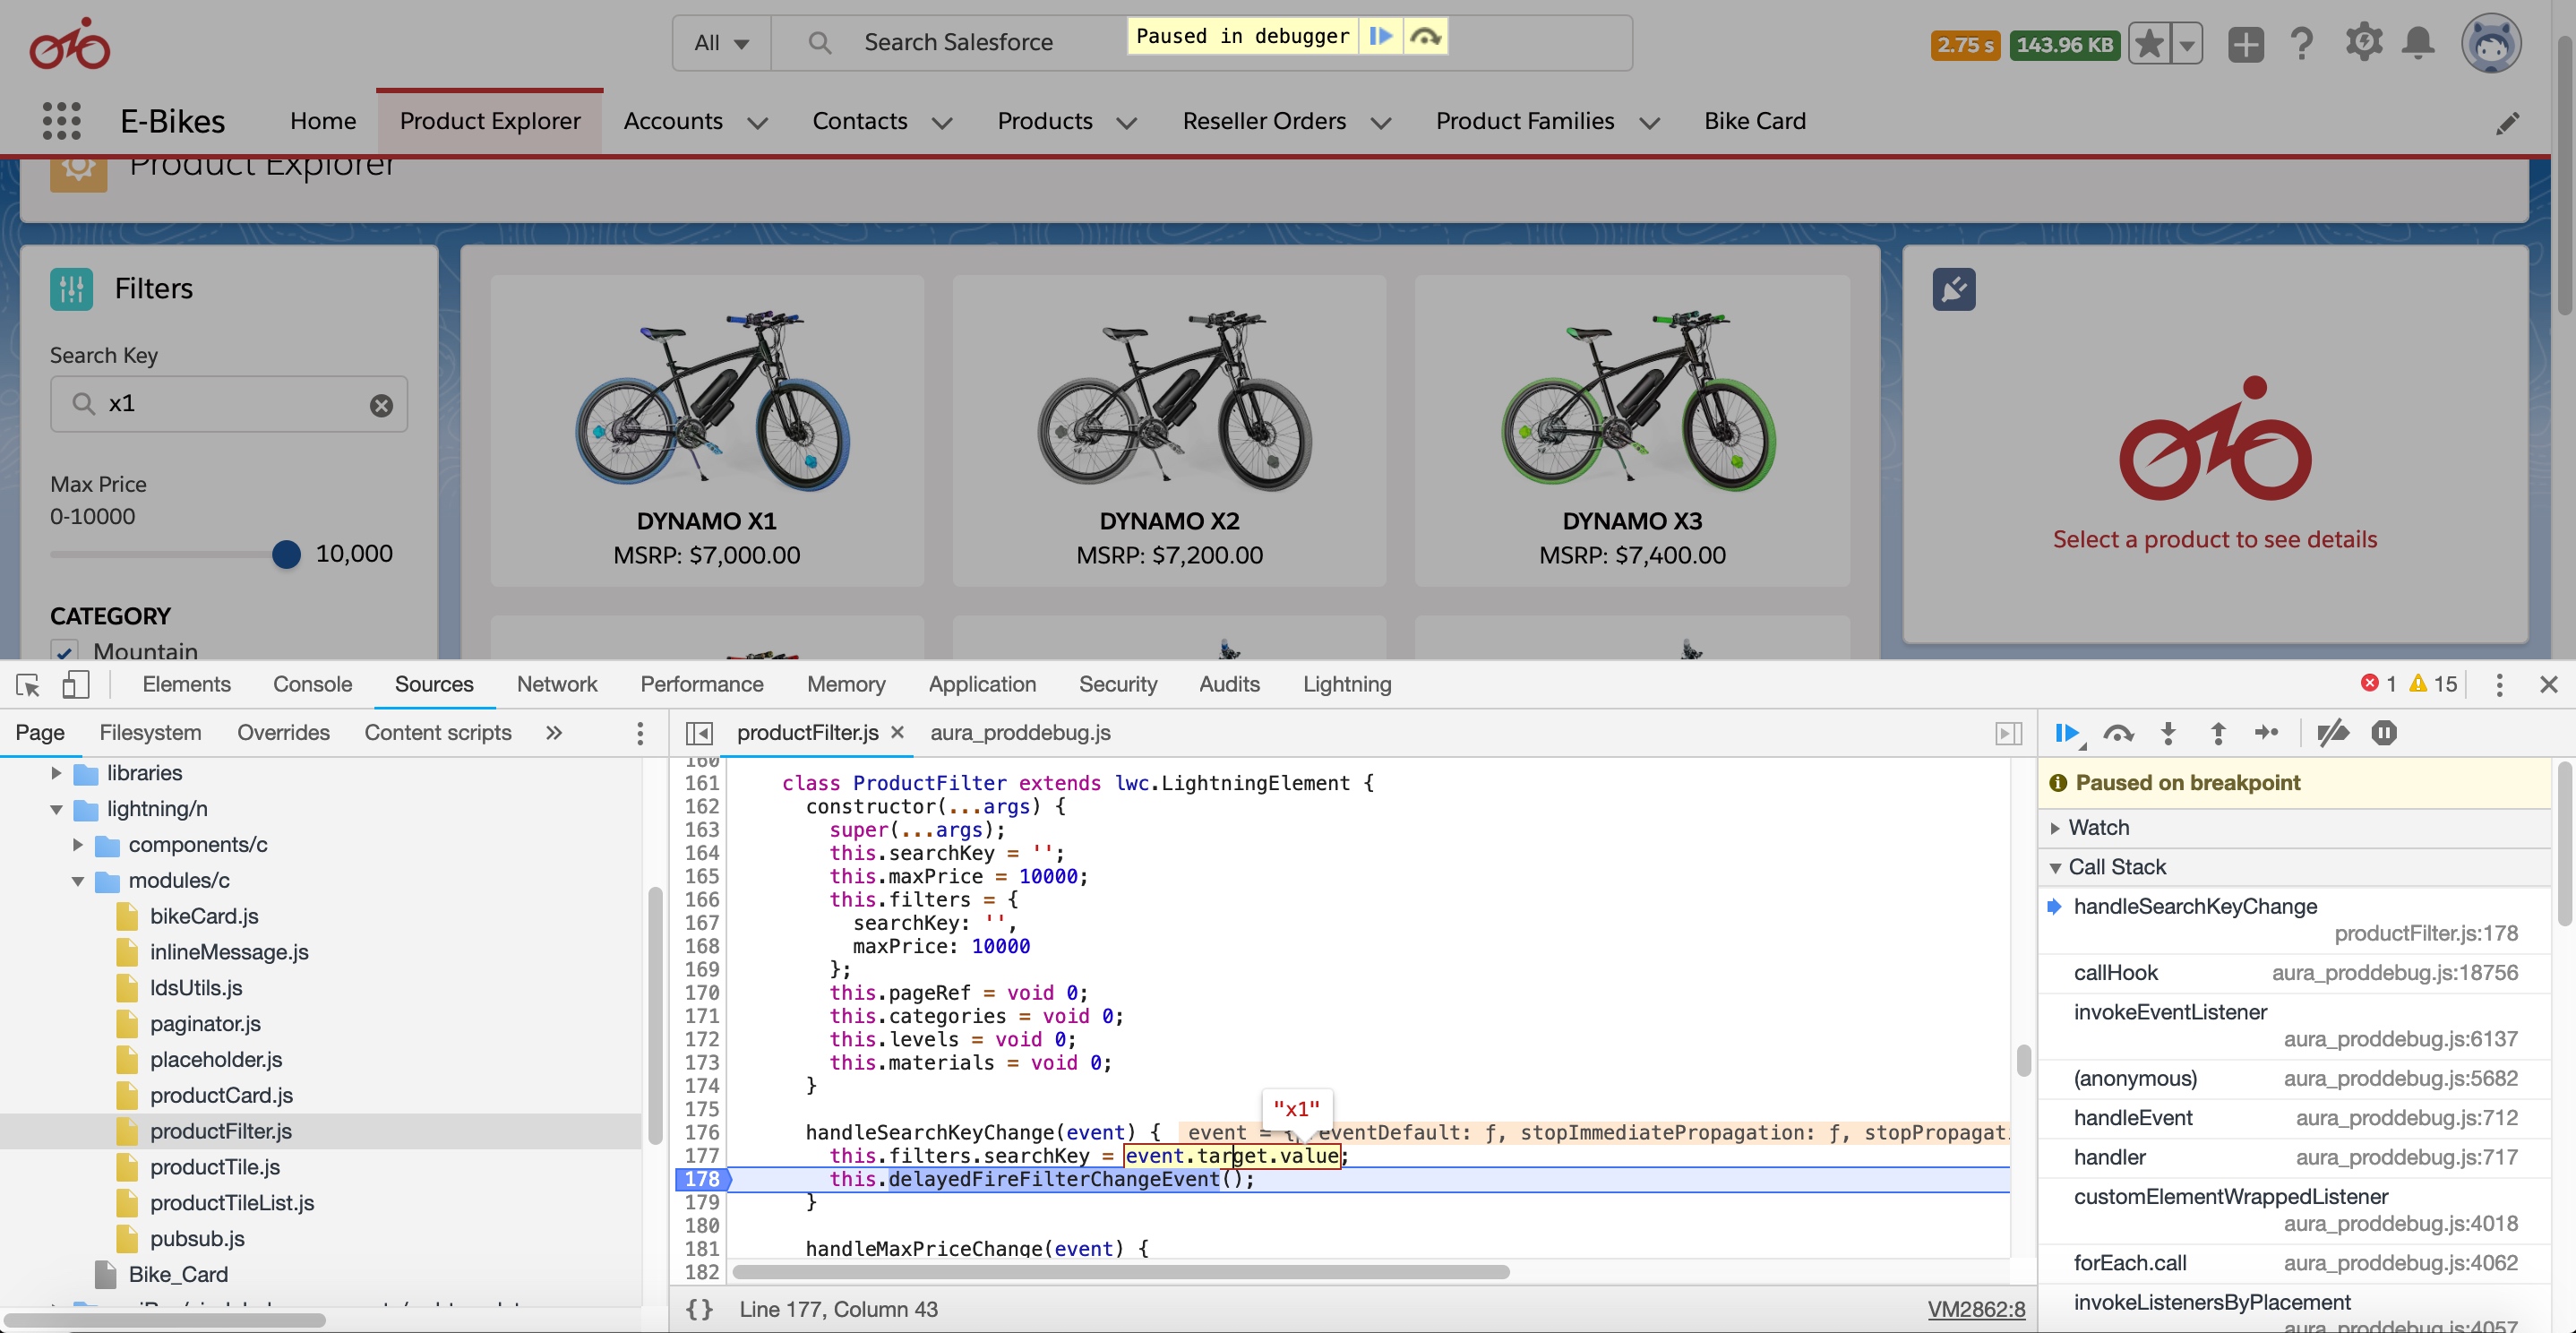
具体方式:
- 打开包含要调试的 Component 页面,鼠标右键或者快捷键(Control-Shift-I or Option-Command-I) 打开 DevTools
- 点击 Sources,在左侧目录找到对应的文件
- 在中间部分,相应的 JS 行号上使用鼠标点击设置断点
- 重新刷新页面,页面会停留在断点处,然后可以查看相关的信息
Config Chrome DevTools
Blackbox JavaScript Source Files
在使用 Chrome DevTools 进行调试的时候,在一行一行查看你的代码的时候,有的时候会进入到你不想查看的代码中(比如 Salesforce 标准的 components 或者第三方库)。Chrome 提供了一个配置,可以屏蔽掉这些不想进入的 js 文件或者目录中。
屏蔽方式
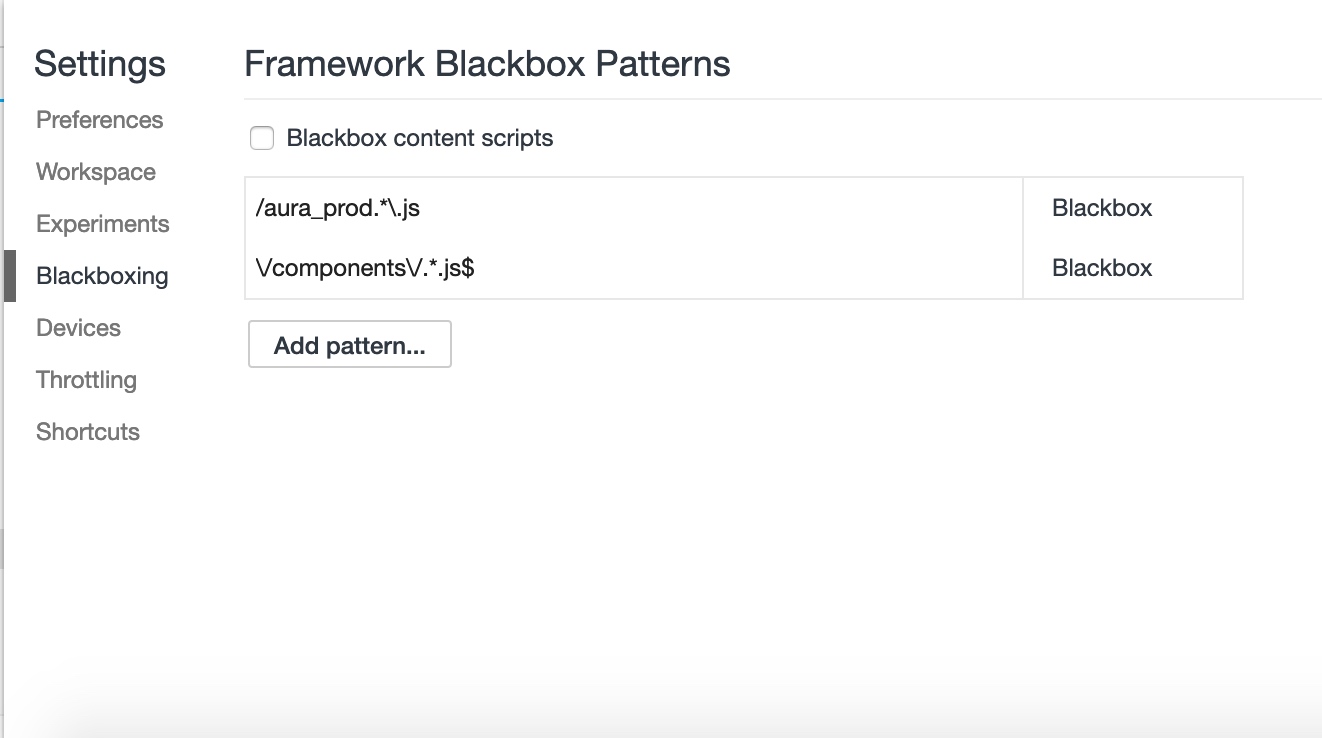
- 在 Settings -> Blackboxing 加入下面的正则,屏蔽 Salesforce 标准库的 js 文件。
1
2
/aura_prod.*\.js$
\/components\/.*.js$
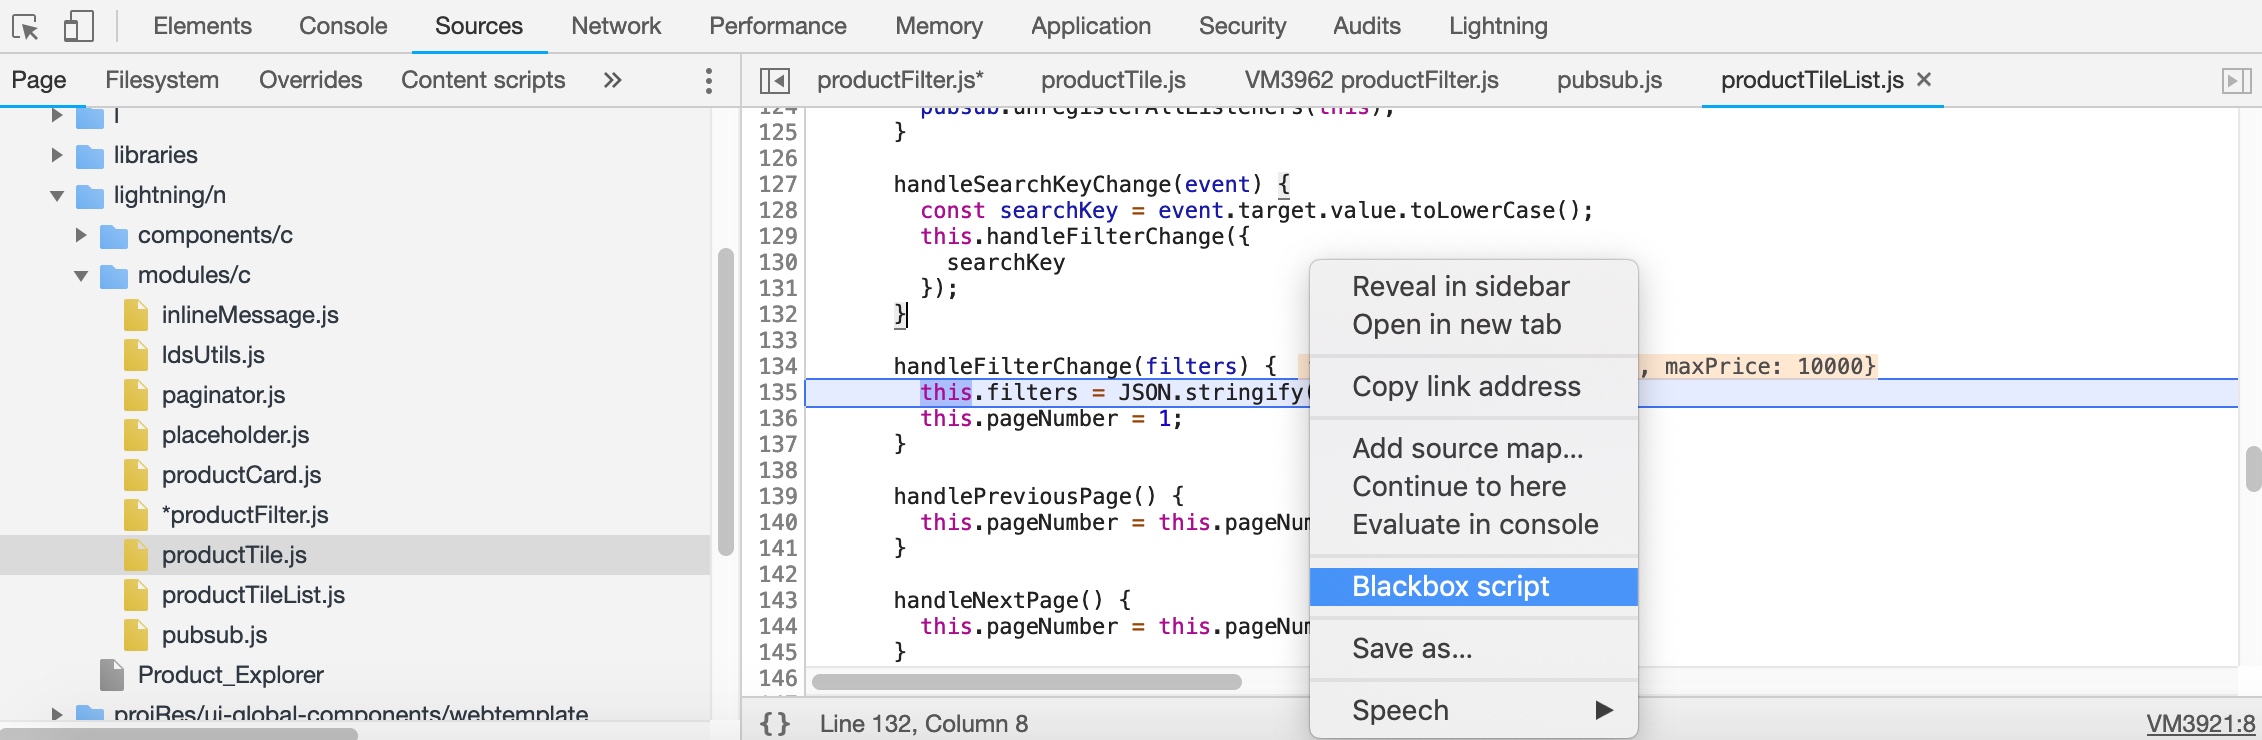
- JS 源文件菜单
在调试的过程中,可以在 js 文件上,点击右键,在菜单中选择 Blackbox script 里屏蔽当前文件。
Enable custom formatters
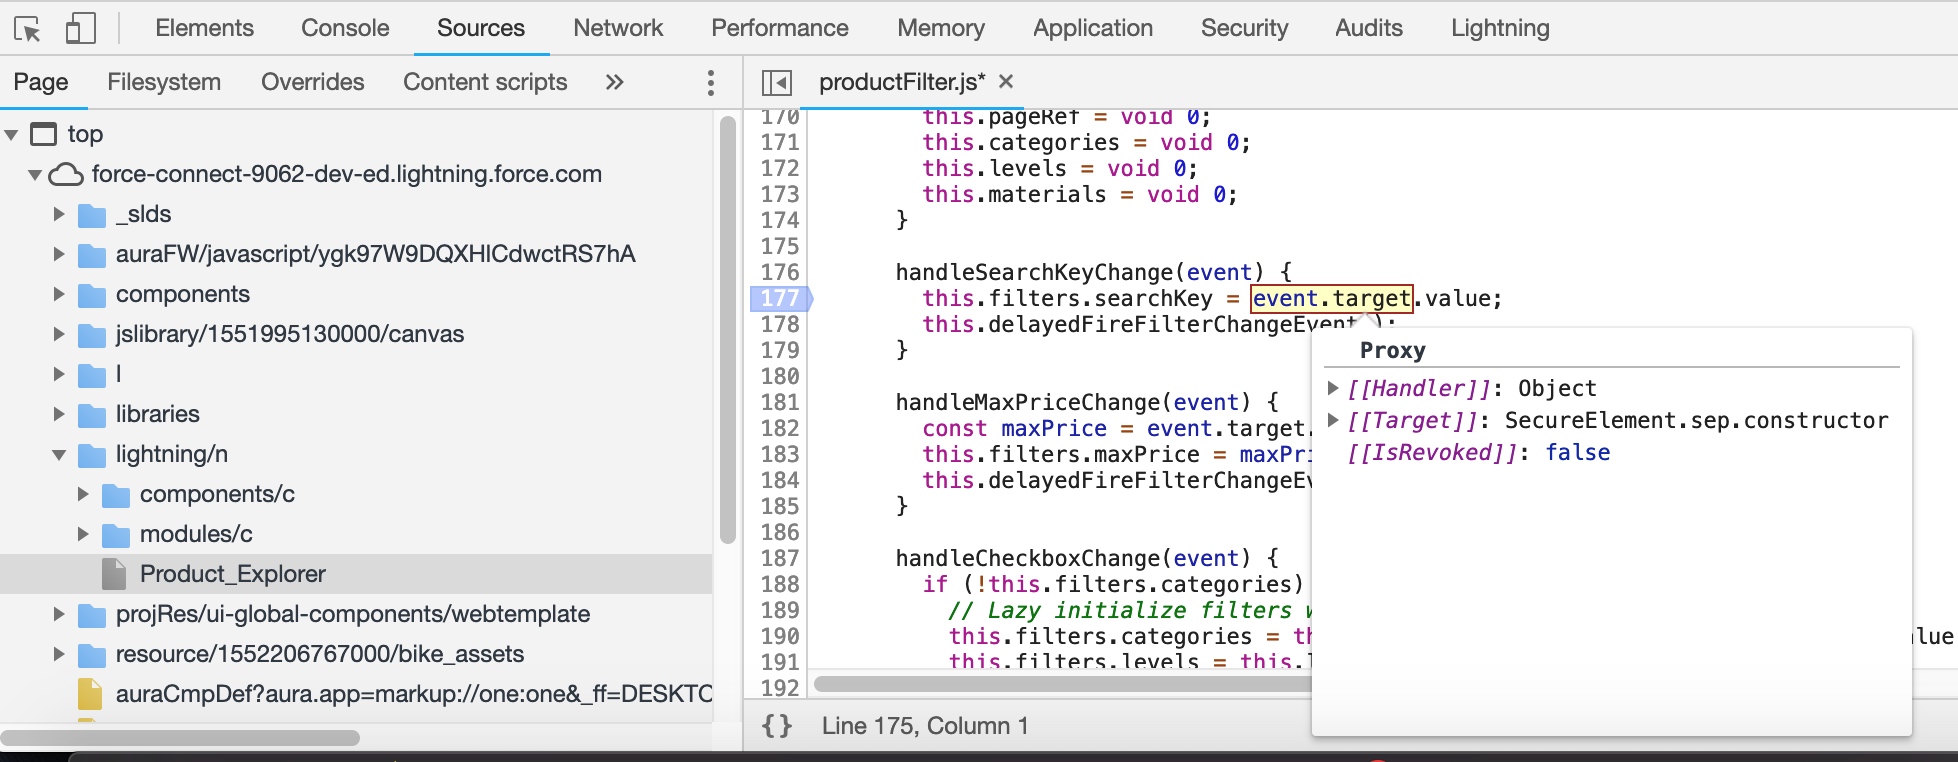
DevTools 默认情况下没有启用 Custom Formatters,这样的话在调试的过程中,属性会显示成 Proxy,不方便阅读和调试。在 Settings -> Preferences 中选中 Enable custom formatters,就可以直接查看当前变量对应的值。
开启前:
开启后:
Resources